UK Low Wages
The first chart shows the unique position of the UK in the rich world in having a growing GDP together with falling wages, see fourth quadrant:
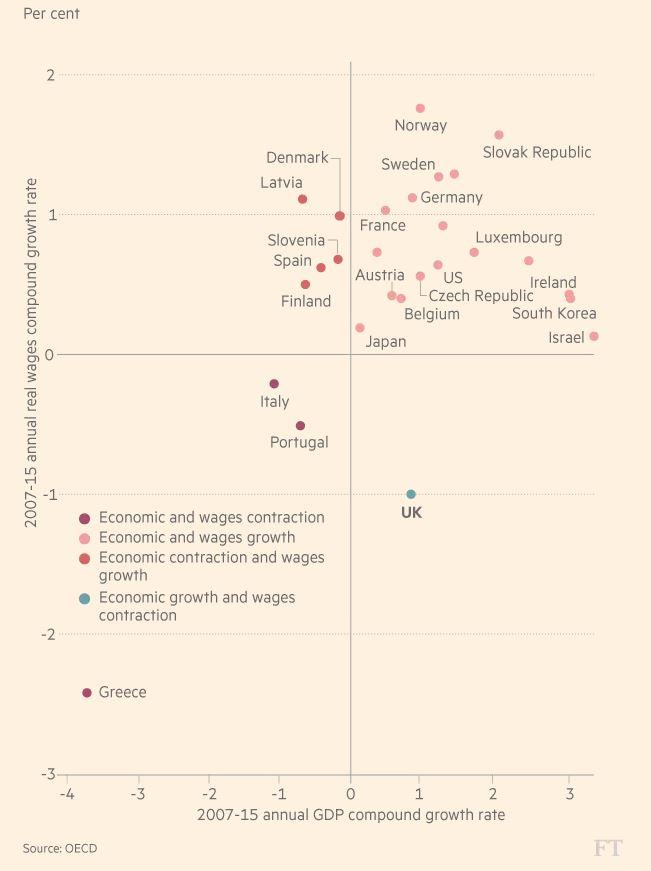
On the right of the vertical line: growth 2007-2015, below the main horizontal line: wages 2007-2015 . the UK is alone is that quadrant.
From the Financial Times March 2, 2017 https://www.ft.com/content/83e7e87e-fe64-11e6-96f8-3700c5664d30
The second chart shows that wages have not grown between 2015 and 2019.
https://fullfact.org/economy/employment-since-2010-wages/

