
Richard Jones
What is climate science?
“Lapses of scientific integrity in climate science have become normalized.”
When I began writing this series, I hadn’t looked critically at any of the real or fake science concerning climate change. I was reacting to the torrent of political and commercial marketing of climate change, promoting for example electric cars with batteries charged by electricity from coal-fired power stations as ‘doing your bit’. There was also a problem, which I haven’t yet confronted, that none of the prophets of doom ever seemed to propose any action to help the people that are supposed to be threatened by climate change. This may have to do with how spurious the threats are, witness the lies about sea rise in Samoa–see the article quoted above: https://rogerpielkejr.substack.com/p/climate-misinformation-from-the-united .
In Australia, Toyota recently expressed satisfaction with its sales, focusing specifically on the popularity of its hybrids. Sad inasmuch as it reinforces thoughts about people with too much money and not enough brains, but nice to see that people with too much money will spend it on what they imagine to be the social good. (Monkey on shoulder saying ‘status status status’, go away! At least they want status for doing good, not just for demonstrating their spending power.) However, the social good is often not a good motivator for honesty.
When I did begin to examine critically the things we are told about climate change, I found, to my surprise, that most of it is somewhere on the spectrum from exaggeration to utter falsehood, and apparently motivated by monetary or political (status, not accomplishments!) gain.
Everything, supposedly, comes from climate science, so I started to look into that.
Before considering climate science, let’s remember what climate is. Climate is ‘typical’ weather. For example, a ‘Mediterranean’ climate has hot dry summers and mild wet winters. Nowadays, with good records of weather variables for recent history, we can be precise about climate with data about temperatures, precipitation, sun and cloud, etc. However, climate is always varying. So it is fairly common practice to use averages for a thirty-year period in order to be reasonably current, rather than averaging since the beginning of record keeping for a location.
In short: climate doesn’t cause weather, it is a statistical summary of weather as a guide of what to expect.
As far as the public discourse (a polite way of referring to media transmission of propaganda) is concerned, climate science has two aspects. One, valid but often presented in a distorted manner, is the collection, presentation, and interpretation, of climate data. The other is climate modelling.
Meteorologists, of course, as well as predicting weather, collect weather data. That doesn’t need climate scientists, although these can have a role for instance in assessing the quality and reliability of data. However, the major difference here is that climate scientists are interested in prehistory, so to speak: elucidating details of climate before people were observing and recording it.
Depending on the time scale, scientists choose from an array of proxies for the temperature record, including tree rings, fossils, ice cores, and isotopes. These give a reliable record, so that in terms of fairly recent times, we can be quite confident, for instance, that the last few decades have been warmer than the previous 1,400 years and more.
To put that last remark in perspective, I am writing in Perth where we are in the midst of a heat wave in the beginning of ‘autumn’. (People persist in dividing the year into four seasons by the calendar, though our Mediterranean climate does not conform.) Our TV entertainers tell us that it’s a ’40 year record’. In other words, we had a more extreme spell 40 years ago. Similarly, I’m guessing that around 1,400 years ago there was a period warmer than the present. In a changing climate, the numbers alone cannot tell us whether the current warming is a random outlier, but climate science can. However, returning to Perth’s heat wave, it is wrong to measure climate change by the extremes. Climate, remember, is a description of typical weather. Extreme events, of whatever kind, are statistically outliers, representative of nothing. (That is not quite true: averages tell most of the story, but variability is part of the description of climate. Individual events are not climate events, but the frequency of extremes certainly is.)
Global average surface temperatures have been rising. Science cannot say that this is a good or a bad thing, so when scientists tell us that climate change is a global emergency, they are acting as publicists, not scientists. First, the warming is an average and is different from place to place. In Australia, it most consistently involves warmer nights. Secondly, the slightly higher temperatures may cause problems (mostly minor) for some people in some places. For others, it brings substantial benefits. Probably nowhere more so than Russia, where thawing tundra opens up new arable land, and melting Arctic ice opens up navigation. Is this why the United States, pre-Trump, hitched a ride on the carbon narrative despite the importance of fossil fuels to their economy?
Climate modelling, done well, is certainly an aspect of climate science. Yet it has become ever more closely enmeshed with the propaganda industry, to the extent that, whether deliberately or not, the modellers tend to be engaged in marketing exercises, not science.
When I was young, weather forecasting was based on an understanding of data, mainly surface pressure maps, and knowledge of local weather patterns. It commonly performed well for a day or two. With supercomputers and a vast increase in data, this changed, so that nowadays we have forecasts for a week or so, quite reliable but a little less towards the end of the week.
Climate modelling is done in a manner similar to weather forecasting, but for a much longer time. It has an advantage due to lack of urgency, but the disadvantages are greater. There is no such thing as local climate modelling. As climate change is always there, everywhere, and climate is long term (30 years is conventional), it’s not possible to predict local climate change without considering the rest of the world.
The greater scope means that compared to weather forecasting, climate modelling has to use larger atmospheric cells. That means that it can’t model some essential details such as clouds, but a much greater problem is the lack of data. Weather forecasts have real 3D information on temperature, pressure, humidity, and more. Other inputs such as solar activity, atmospheric carbon, etc, either vary slowly or their effects vary slowly, and are not needed in a weather forecast.
The solution to these problems? Guess! Or in sci-speak, ‘parametrize’. In context, this can be legitimate. To understand the motion of galaxies you might (I have no idea if this has been done) ‘guess’ the distribution of ‘dark matter’, and guess again if the model doesn’t match observations. However with climate modelling, there is little checking against observations, as it is a political crystal ball gazing exercise. The outcome of the model depends on a choice of ‘scenario’, in which the main input is a prediction of atmospheric CO₂.
So, when I thought I was examining climate science, it seems to me that what I was looking at was a political process dependent on the corruption of science. Putting aside questions about how accurate the models can be, it is possible to run models where CO₂ and other uncertain data are varied, and output dozens of different outcomes according to the varied inputs. Unfortunately, too much modelling has been done with limited and improbable ‘scenarios’.
So: is recording and modelling the beginning and end of climate science? Of course not! It is maybe a distraction from climate science, maybe a special zone of climate science, but it is definitely a branch of media opinion manipulation.
Climate is not just surface temperature. Yet publicists for a global emergency due to humans rely as evidence on data showing a gradual increase in average surface temperatures. They claim that this reflects an energy imbalance. Greenhouse gases trap outgoing radiation (this much is incontestable and without it there would be no life on earth) but more importantly, they trap more of it due to human carbon dioxide (mainly) emissions.
Unfortunately, as serious climate scientists point out, a surface has no mass and therefore no heat content. So why do the publicists not look for (or at) evidence of heat content? At evidence of the heat imbalance?
Fortunately, this is one of the things climate scientists have been doing, for a long time, so that, for example, measurements of deep sea temperatures provide evidence of the total heat content of the oceans.
The outcome of these measurements seems to conflict with the stories built on the shifty foundation of heatless surface temperature measurements. It turns out that periods of steady increase or decrease in temperature are separated by relatively sudden changes in the rate of change (the slope, on a graph). From 1963 to 2008, there were three periods of positive heat imbalance, and three negative. The greatest imbalance, in 1963-1966, was negatve, but the other two negative periods were within the margin of error, so possibly spurious. Moreover zero or very small negative imbalance implies overall heat in the biosphere, due geothermal heating.
The overall trend is warming, at least since 1966. That much is consistent with concerns about global warming. However, if the main input to the warming was anthropogenic, and specifically, greenhouse gas emissions, the heat imbalance could not have these ‘climate shifts’ where the imbalance changes suddenly. Rather, the imbalance would be gradually increasing, as the carbon dioxide gradually increases.
I have not yet looked into explanations of the climate shifts. I presume climate scientists will have at least asked questions, and hope to find some answers, even if speculative, to report in a later article.
Ocean heat content and Earth’s radiation imbalance. II. Relation to climate shifts. D.H. Douglass, R.S. Knox, Physics Letters A 376 (2012) 1226–1229. doi.org/10.1016/j.physleta.2012.02.027
—————

Fig. 1. Ocean heat content from NODC (see Section 2). Red arrows are the dates of seven climate shifts (CS) reported by Douglass [8,12]. These seven CS define seven time segments. The one standard deviation uncertainties are shown by the green curves. The solid red lines are the slopes for the seven time segments. Values of the slopes and the implied radiation imbalance are given in Table 1 and are plotted in Fig. 2. (For interpretation of the references to colour in this figure legend, the reader is referred to the web version of this article)
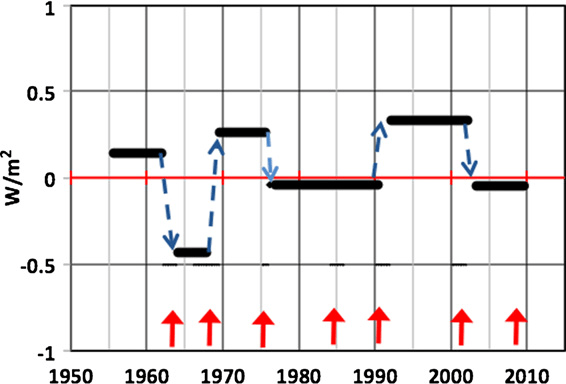
Fig. 2. Plot of implied radiation imbalance vs. date. The plot shows value alternating about 0. The radiation imbalance is never greater than 0.5 W/m2.
